- November 4, 2019
- Blog , The Portfolio Strategist - Terry Gardner
C.J. Lawrence Weekly – Low Bond Yields Keep CJL Market Monitor Firmly Tilted Toward Stocks
We run our C.J. Lawrence Market Monitor at the end of each month to measure the relative attractiveness of stocks versus bonds, and to test the internal technical health of the stock market. The Monitor was created in the early 1980s as an asset allocation tool and has served as a useful barometer through most market gyrations. While the Market Monitor was not constructed as a timing model, over its 39-year lifetime it has generated some timely shifts. Of note are the SELL signals generated prior to the stock market crash of 1987, and again in the period leading up to the bursting of the internet bubble in 2000. The Monitor score dipped into neutral territory prior to the financial crisis in 2007 but quickly reversed course as quantitative easing drove interest rates towards 0% in 2008. As the economy climbed out of recession, the Monitor re-assumed a bullish stance on equities as record low yields on treasury bonds posed little competition to an even modest earnings yield on stocks. Over the past several months the Monitor’s bullishness has firmed and now stands at a +5 out of a potential +6.
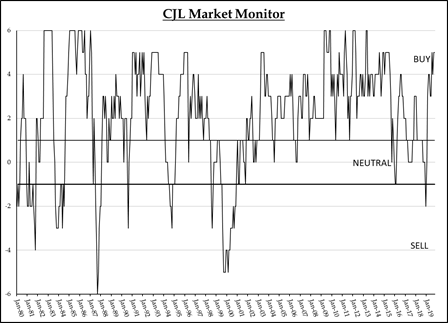
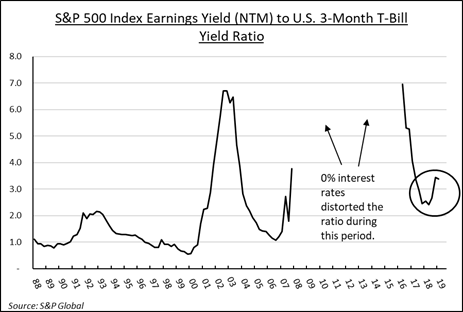
Each of the Monitor’s six components is constructed to generate individual BUY, HOLD, and SELL signals. Two of its components are driven by the comparison of equity fundamentals to bond yields, two by the direction and rate of change in short and long-term interest rates, and two by technical and market breadth indicators. The comparison between earnings yields and U.S Treasury T-bill yields had been normalizing over the past few years, but cuts to the Fed Funds target rate by the Federal Reserve have helped strengthen that component’s bullish posture. Both interest rate models flipped bullish recently as rates at the short and long end of the yield curve fell below last year’s levels. Currently, the weakest reading within the Market Monitor is the NYSE Composite Moving Average Spread Model which captures breadth and momentum. That reading may strengthen in November as the bull market regains its gallop.
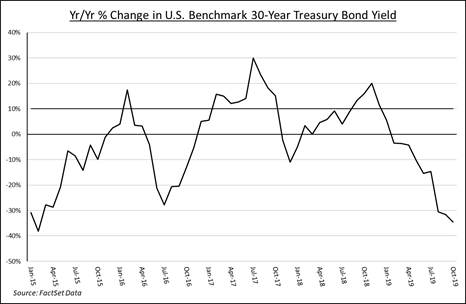
Earnings reports for 3Q19 have been coming in ahead of reduced expectations so negative earnings revisions look limited at this point. If earnings forecasts hold the line, and bond yields track inflation expectations (low), a strong bullish reading from the Market Monitor is likely to persist. The 30-Year Benchmark U.S. Treasury Bond yield averaged 2.2% in October versus 3.4% in the same month last year. The November comparison will be nearly as challenging. For our long bond model component to flip back negative, long yields would need to rise over 100 basis points. That doesn’t look likely in the near term. U.S. Treasuries will retain their safe-haven status, but the CJL Market Monitor reading suggests that return seekers should stay over-weighted in equities.
Terry Gardner Jr. is Portfolio Strategist and Investment Advisor at C.J. Lawrence. Contact him at tgardner@cjlawrence.com or by telephone at 212-888-6403.