- January 22, 2019
- Blog , The Portfolio Strategist - Terry Gardner
C.J. Lawrence Weekly – 2019 Outperformance May Be Found in Unlikely Places
The stock market is off to a good start in 2019. The rally began the day after Christmas and has continued through the first few weeks of January. Investors expecting a Santa Claus rally in December had been sorely disappointed by the lump of coal they received instead. But Santa looks to have found his sleigh and while late, has delivered a potent rebound off December lows. The S&P 500 is up 6.5% year-to-date and is up 13.6% since December 24, 2018. Leading the way have been Energy shares, +18.4% since 12/24/18, which have followed the recent bounce in oil prices, and Financial Services stocks which have rallied 16.5% during the same period. Both sectors also lead the year-to-date performers, followed closely by the Industrials and Consumer Discretionary sectors. All S&P sectors are in positive territory for the year and market breadth has been expanding.
For the past decade the S&P 500, which is comprised of 500 large capitalization stocks selected by a committee, has dominated U.S. index performance tables. But recently, as stocks have bottomed and rallied, the S&P 500 has lagged most of the broader market indices. Year-to-date, the S&P 500 trails the Russell 2000 Index by 340 basis points, the Wilshire 5000 (which, despite its name, actually contains only 3,486 stocks) by 52 basis points, and the NYSE Composite Index by 30 basis points. The NYSE Composite has historically been a good gauge of broad market health as it measures the performance of over 1,900 stocks listed on the New York Stock Exchange, of which over 1,500 are U.S. companies. The Index excludes closed-end funds, ETFs, limited partnerships and derivatives. The relative performance of the NYSE Composite versus the S&P 500 trends in long waves that provide useful insights into investor portfolio concentration and performance.
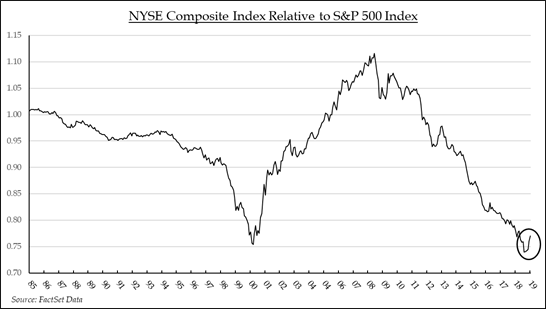
During the bull market of the 1990s, appreciation in large capitalization technology and financial shares propelled the S&P 500 to new highs, creating the only competition for capital with the new issue market. Then, when the internet bubble burst in 1999 and recession took hold in 2000-2001, investors who had been stung by holding large concentrated technology, financials, and health care positions, diversified their sector exposure. The 2000-2008 period was marked by a broadening of ownership into energy, staples, and industrials. The NYSE Composite Index outperformed the narrower S&P 500 through most of that decade. The financial crisis in 2008 represented another turning point. The evolution of social media, cloud computing, and ecommerce bred new leadership that was dominated by a handful of giants at the top of the S&P 500 leader board. Investors once again flocked to a select group of stocks and to the growing number of Index Funds and Exchange Traded funds that owned them. Investor concentration in many of these securities may ultimately have been a catalyst to the market’s recent sell-off. While it’s still early in the turn, the relative trend favoring the S&P 500 is showing signs of reversing. As the calendar moves deeper into 2019 and investors are faced with diminished prospects for S&P 500 Index profit growth, the search for performance will likely intensify outside the S&P 500. The message from the past three weeks may be that while the broader markets have rebounded, outperformance for the balance of the year will likely be found in unlikely places.
Terry Gardner Jr. is Portfolio Strategist and Investment Advisor at C.J. Lawrence. Contact him at tgardner@cjlawrence.com or by telephone at 212-888-6403.