- October 15, 2019
- Blog , The Portfolio Strategist - Terry Gardner , Uncategorized
C.J. Lawrence Weekly – The Running (Away) of the Bulls
If last week’s trade deal optimism carries through, the S&P 500 could make another run at its recent peak. The last high was made on July 26 and was tested and failed in mid-September. But generally, the stock market has traded within a range since February. Technicians will take note of the next rally to see if the market has the thrust to push through the range’s upper barrier. Another failure could be interpreted as the bull’s ultimate defeat. The inability to make new highs may be dampening stock investor enthusiasm. But last week’s positive news on trade, and a reassuring Consumer Sentiment report from the University of Michigan, on the back of overwhelming bearish market sentiment, helped give the market a lift on Thursday and Friday. Contrarians will note that negative sentiment often coincides with washed out equity positioning and can often result in near-term rebounds.
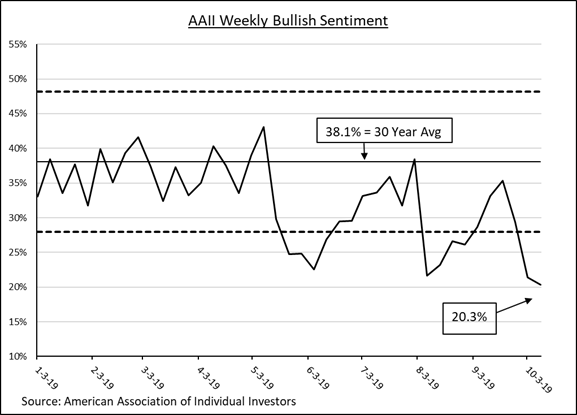
The American Association of Individual Investors has been publishing its weekly survey of investor sentiment since the 1980s. While the readings don’t always correlate with week-to-week stock price moves, the survey provides a useful barometer of stock market sentiment. Recent surveys have shown a steady decline in bullish outlooks among participants, with last week’s reading hovering just above 20%. That compares to a long-term historical average of 38.1%. The current bullish reading is the lowest since May of 2016 and is approaching a negative two standard deviation spread from the average. The contrarian argument suggests that there is now little room for further decreases in bullish sentiment and therefore optimism will improve, and investors will rejoin the hunt for attractive stocks.
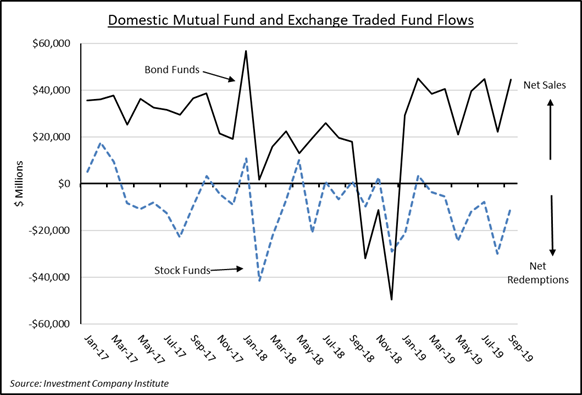
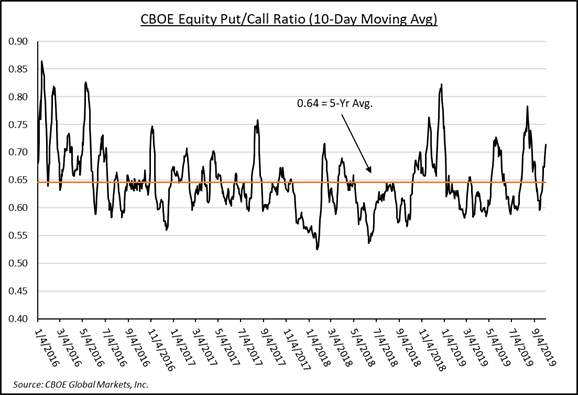
Meanwhile, net outflows from domestic equity mutual funds and exchange traded funds suggest that retail investors not only have a dim view of the stock market but continue to vote with their wallets. Year-to-date domestic equity funds have experienced over $110 billion of net outflows while bond funds have experienced over $325 billion in net inflows! That trend continues, with investors pulling almost $10 billion from equity funds and adding over $44 billion to bond funds in just the past five weeks. The outlook among institutional investors is not much rosier. The ratio of equity put option buying (bearish bet) versus equity call option purchases (bullish bet) spiked in September and remains elevated. The split between pessimistic stock market sentiment and optimistic U.S. consumer economic sentiment sets up an interesting backdrop. Historically, washed out investor sentiment was a precursor for a rally. Upcoming trade and economic news and date could become the accelerator or the brake.
Terry Gardner Jr. is Portfolio Strategist and Investment Advisor at C.J. Lawrence. Contact him at tgardner@cjlawrence.com or by telephone at 212-888-6403.