- April 8, 2019
- Blog , The Portfolio Strategist - Terry Gardner
C.J. Lawrence Weekly – Profit Bulls Have History on Their Side
Last week’s jobs report seemed to strike the right tone with the stock market. The U.S. Labor Department calculated that March nonfarm payrolls advanced by 196,000 versus an estimate of 175,000, and that the U.S. unemployment rate remained unchanged at 3.8%. Prior to its release the report was anticipated to be a market moving event if the result varied meaningfully from the estimate one way or the other. Interestingly, there appeared to be bears on both sides of the debate. A meaningful lower-than-expected result would likely have fanned the economic slowdown flame and raised the chorus of those projecting near term recession. Conversely, a meaningful better-than-expected payroll report might have caused bonds to sell-off, treasury yields to spike, and bolstered the “rising rates are bad for stocks” argument. Instead, the middle-of -the road result kept the bears in their dens and stocks rallied. The S&P 500 Index finished up 2.3% for the week.
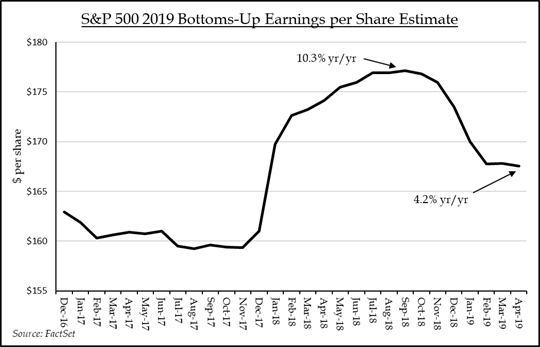
But the debate regarding the trajectory of the economy and corporate profits is hardly settled. 1Q19 S&P 500 profits are now expected to decline 3.0%, and analysts are expecting full year 2019 earnings per share growth of only 4.2%. The cadence of quarterly growth expectations calls for 1.4% growth in the second quarter and 2.5% EPS growth in the third quarter, leaving it up to the fourth quarter (+8.6%) to lift the full year result, according to Fact Set data. Looking out beyond 2019, analysts are expecting a reacceleration of growth in 2020, with forecasts calling for 11.4% EPS growth on the back of a 5.3% advance in top line growth. To us, the outlook for 2020 sales and earnings growth looks murky, but history suggests that following two consecutive years of net income declines, earnings growth can continue for half a decade or more.
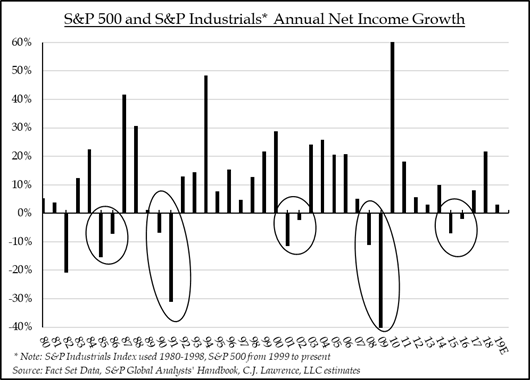
We analyzed the consolidated net income for the S&P 500 and S&P Industrials back to 1980 and found five periods when net income declined for two consecutive years followed by several consecutive years of net income growth. We used S&P Industrials Index data prior to 1999 because we viewed it as the best data available for that period. Our work shows that in four of those five periods net income grew for five or more consecutive years post the two-year declines. The exception was the 1985-1986 period which was followed by only three consecutive years of net income growth. While S&P 500 earnings per share grew in 2016, the Index’s net income, which excludes the impact of share count contraction, actually declined, making 2015-2016 the latest period of two consecutive annual net income declines. Since 2016, S&P 500 net income has risen for two consecutive years (2017 and 2018) suggesting, that if history repeats, there is more gas left in the tank. An average cycle of two years of net income declines followed by five consecutive years of net income improvement suggests that the Index’s net income can continue to grow until at least 2022, bolstering the analysts’ case for a reacceleration in earnings growth. There is a plethora of risks to today’s economic and profit growth forecasts, and a profits recession in the next 12 months should not be ruled out. But income growth is a key ingredient of a sustained bull market, and history remains on the side of the bulls.
Terry Gardner Jr. is Portfolio Strategist and Investment Advisor at C.J. Lawrence. Contact him at tgardner@cjlawrence.com or by telephone at 212-888-6403.