- February 18, 2019
- Blog , The Portfolio Strategist - Terry Gardner
C.J. Lawrence Weekly – Global Freight Indices Showing Softness
The better-than-expected trade data out of China last week was downplayed by most economists who suggested that the data may have been distorted by the timing of the Chinese Lunar New Year. Nonetheless, optimism has been rising, particularly in the Chinese equity markets, that a U.S.-China trade deal is close at hand and that once inked, trade levels will return to pre-stand-off levels. But another school of thought is emerging questioning the achievability of China’s target rate of economic growth and whether additional stimulus can reverse China’s GDP growth slide. The answer to that question has broad implications for the global economy. As the world’s second largest economy, China consumes close to half of the world’s production of important raw materials including copper (50%), aluminum (47%), nickel (56%), coal (50%) and cement (59%) and generates over 13.8% of the world’s exports of finished goods, according to 2017 data compiled by Statista.
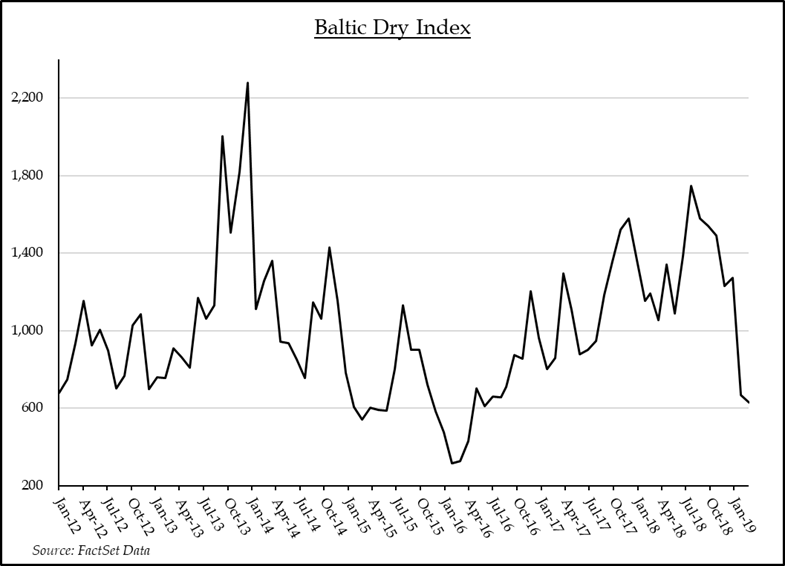
The Baltic Dry Index (BDI) is regarded as a good indicator of global economic activity and trade since it tracks demand for dry bulk freighters in major global shipping lanes. As its name suggests, dry bulk freighters carry a range of “dry” commodities including coal, iron ore, agriculture products, and other metals and ores that are viewed as key ingredients in industrial and manufacturing activities. Given China’s voracious appetite for these materials, the BDI is considered a good leading indicator of Chinese economic output. The signal it is currently sending is that Chinese economic growth may be slower than consensus forecasts. The BDI reached a 5-year high in July of 2018 but is now down 66% from that level and is down 52% year-to-date. The U.S. – China trade tussle may have contributed to softer bulk freighter demand, but the magnitude of the decline suggests that something secular may be underway, and the impact is being felt by China’s trading partners around the globe. A recent report from the International Air Transport Association confirmed the global trade deceleration in its recent global air cargo report which showed a year-over-year increase in shipments in 2018 versus 2017 levels but confirmed that air freight traffic declined precipitously towards year-end, including a 4.8% decline in Asia-Pacific air freight traffic in December.
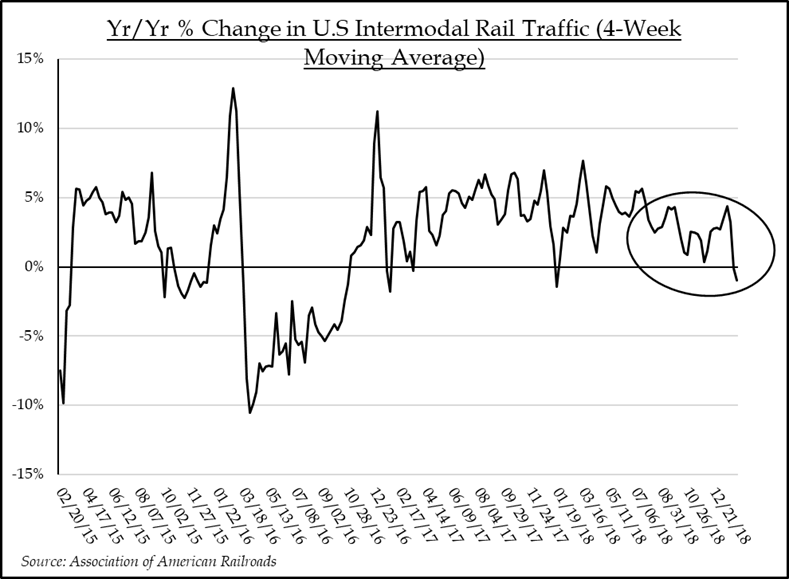
Meanwhile, the freight transportation picture in the U.S. looks better but is far less ebullient than it was a year ago. U.S railcar loadings are up only 0.9% year to date, versus the same period last year, and intermodal (shipping containers on rail cars) traffic is up only 1% according to recent data from the Association of American Railroads. Truck traffic shows similar trends. The American Trucking Association’s truck tonnage index showed a healthy 2018 improvement over 2017 levels, but their report noted that their tonnage index fell 4.3% in December after declining a combined 5.6% in October and November. Finally, the Cass Freight Index, which tracks shipment activity across thousands of U.S. companies also saw degradation in their year-end indicators, including a 0.8% decline in December shipments, after being down 1.7% in November. A disappointing retail sales report from the U.S. Commerce Department and a lackluster January Industrial Production result have added to the slowing growth narrative. Manufacturing bulls may take heart in last week’s U.S. Manufacturing PMI result which showed a rebound in purchasing manager optimism in January. But even a bounce in optimism may take months to cycle through the global supply chain. The good news is that the service sector of the U.S. economy looks to be in good shape. But the manufacturing and industrial backdrop looks challenged and may put pressure on industrial and materials stocks which are up 15% and 6.5% year to date, as well as select consumer discretionary groups including autos, auto components, and household durables, which are up 14%, 20%, and 18% respectively during the same period.
Terry Gardner Jr. is Portfolio Strategist and Investment Advisor at C.J. Lawrence. Contact him at tgardner@cjlawrence.com or by telephone at 212-888-6403.