- January 8, 2018
- News & Media
Why Fund-Flow Stats Aren’t the Indicator They Used to Be
C.J. Lawrence’s Portfolio Strategist and Investment Manager Terry Gardner on how fund-flow data is still used.
Ву Simon Constable | January 7, 2018 10:03 p.m. ET

Whether the traditional fund-flow data will be of any use in calling a market top this time is an open question.
РНОТО: ISTOCKPHOTO/GETTY IMAGES
Smart investors used to be able to identify market tops and bottoms by watching the weekly flows of money into and out of mutual funds.
Then came the stampede into exchange-traded funds, and the crystal ball for predicting market shifts grew cloudy.
Because weekly flow data now measures not just money moving into or out of mutual funds or between stock and bond funds, but also between one type of investment product (stock mutual funds) and another (lower-cost ETFs), the data has lost much of its usefulness for gauging small-investor sentiment toward equities in general.
Strategists still keep close watch on the aggregate weekly flows into or out of U.S. stock-focused mutual funds to get an idea of what individual investors are doing on a macro level. Some 95% of long-term mutual-fund assets (which includes around $10 trillion in stock funds) are owned by retail investors, according to estimates from the Investment Company Institute.
“We’ve always used fund flows to measure investing styles, bond versus equities; we use it as a sentiment of retail [or individual] investors,” says Terry Gardner, senior managing director at CJ Lawrence LLC in New York.
What has changed, however, is experts’ confidence in the ability to use the flow data to call a broad market shift.
What 2008-09 Taught Us
Fund investors sold heavily as the market dropped in 2008-09, setting up the market for the rally that followed. Net new cash flow into U.S.-stock mutual funds, against the S&P 500’s performance
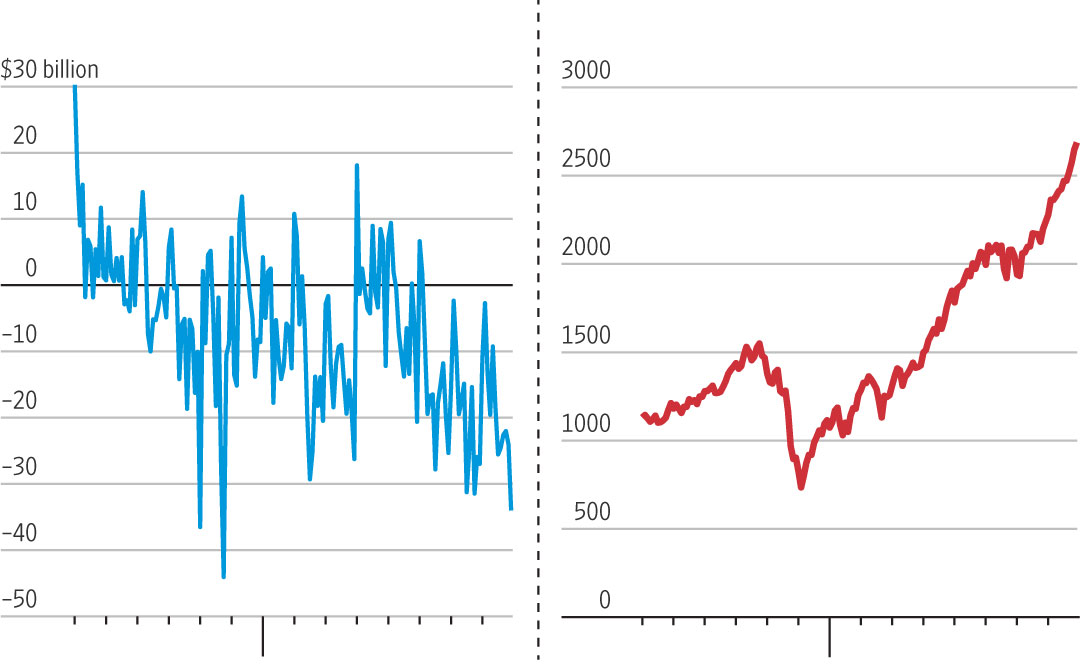
Flows into U.S.-stock funds
S&P close 2004’10
To understand how that worked in the past requires a bit of reverse psychology. Namely, recognizing that individual investors are often perfectly bad market timers: They have a record of selling low and buying high. Thus, the worst excesses of each tendency tend to be seen at market peaks and troughs.
Back in 2008 and 2009, for example, mutual-fund investors sold heavily as the market fell. The dumping reached its zenith as the market hit bottom, as the accompanying chart shows. Those watching fund flows thus had a pretty good indication that a market shift was under way. Similarly, in the late 1990s, individual investors piled into stock funds as the market peaked, signaling a reversal was imminent.
Assessing the current situation, Mr. Gardner says, “we continue to see outflows from domestic equities and inflows to bond funds; that tells you the retail investor hasn’t fully bought into the rally.” In other words, small investors haven’t yet gone crazy for stocks, as they did in the late 1990s.
That’s useful as far as it goes. But whether the traditional fund-flow data will be of any use in calling a market top this time is an open question.
It all changed
The reason for doubt is that over the past decade, individuals have changed the way they invest. Increasingly they are moving out of actively managed mutual funds and into lower-cost indexed mutual funds and ETFs, says Shelly Antoniewicz, senior director, industry and financial analysis, at ICI. Those shifts are believed to be driven by cost considerations and by financial advisers moving clients into lower-cost products including ETFs, Ms. Antoniewicz says. Thus, flows out of mutual funds may have zero to do with market sentiment and much to do with the long-term trend of small investors moving to ETFs.
Institutions, hedge funds and portfolio managers increasingly use ETFs, too, says Arthur Hogan, chief market strategist at B. Riley FBR in New York. A portfolio manager may want to sell short the SPDR S&P 500 ETF, which tracks the S&P 500, to protect from a drop in the market. Portfolio managers switching investments between sectors also sometimes use ETFs to park money before a final investment choice is made.
Flow data that is made public, meanwhile, doesn’t distinguish between money of institutions and small investors.
“Anecdotally we understand that there is a 50-50 split between retail and institutional, but we don’t have data on that,” she says. “The data is closely held by brokers.”
Nevertheless, institutional investors tend to invest differently from individuals, so big institutional moves will skew the data away from what small investors are doing. Even more so, because while small investors tend to buy high and sell low, institutions typically do the opposite.
In seeking to determine whether fund flows are still a useful market bellwether, one could argue that ETFs were around during the last downturn in 2008 and that market watchers at that time were able to use flow data to spot a market reversal. ETFs then, however, were a smaller part of the retail investing picture. At that time, they held around half a trillion dollars in stocks, bonds and other assets, according to ICI. By 2016 that had grown to $2.5 trillion.
Since that time, we’ve had no major market reversal and thus no new data to use as a basis for new conclusions. Of course, both of those situations will eventually occur, at which point we’ll have the data.
Use in combination
Meantime, market professionals say it can make sense to use the flow data in conjunction with other indicators when trying to decide whether the market has reached a pinnacle or a trough.
Stephen Wood, chief market strategist at Russell Investments, says it is worth adding sentiment metrics into the analytical mix.
Russell uses proprietary sentiment measures. For the rest of us, the American Association of Individual Investors publishes a regular Sentiment Survey indicating how bullish or bearish individual investors feel about the market.
If the metric looks very bullish and there are major fund flows into stocks, it would support the view that the market was peaking. If the AAII data is bearish and investors are dumping stock funds, that’s a bullish indicator.
Mr. Constable is a writer in Edinburgh, Scotland. He can be reached at reports@wsj.com.
Copyright 2018 Dow Jones & Company, lnc. AII Rights Reserved