- May 13, 2019
- Blog , The Portfolio Strategist - Terry Gardner
C.J. Lawrence Weekly – Recent Volatility May Test the CJL Market Monitor’s Bullish Stance
The C.J. Lawrence Market Monitor was created in the early 1980s to measure the relative attractiveness of the stock market versus bonds, and to test the internal technical health of the stock market. Over the Monitor’s 38-year history, it has been a useful asset allocation tool. While not developed as a timing model, the SELL signals generated prior to the stock market crash of 1987, and again in the period leading up to the bursting of the internet bubble in 2000, are two of the Market Monitor’s more notable readings. Post financial crisis the Monitor assumed a very bullish stance on equities as record low yields on treasury bonds posed little competition to even modest earnings yields on stocks. Over the past several months the Monitor’s bullishness has firmed and now stands at a +4 out of a potential +6.
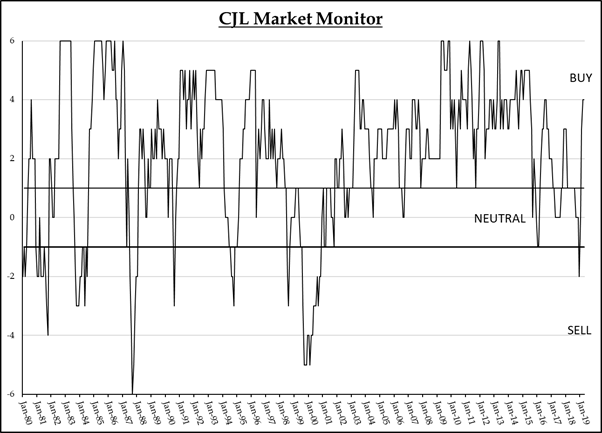
Each of the Monitor’s components is constructed to generate individual BUY, HOLD, and SELL signals. Two of its components are driven by the comparison of equity fundamentals to bond yields, two by the direction and rate of change in short- and long-term interest rates, and two by technical and market breadth indicators. Currently the two components incorporating equity fundamentals are positive, the short-term treasury yield model is negative, and the long bond model is positive. It is uncommon for the two interest rate models to move in different directions, but the flattening yield curve has pushed the long end of the curve below last year’s level. Both technical models are generating positive readings, but that could change next month as a result of recent share price volatility.
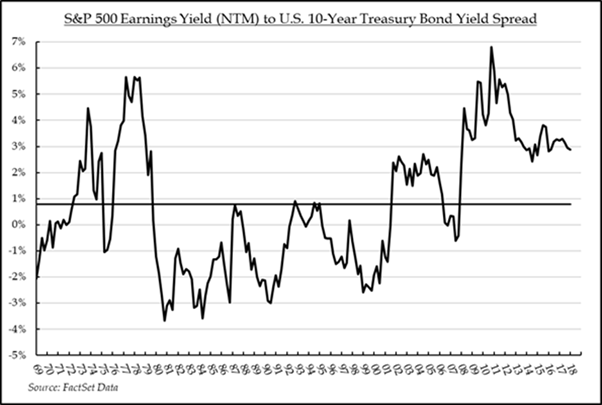
For additional perspective, it can be instructive to look at the spread between the earnings yield on the S&P 500 (the inverse of the Price/Earnings ratio) and the 10-Year Treasury Bond yield over time. Since 1969 the differential has averaged 0.78. It now stands near 3.3%, making stocks the heavy favorite. A common rule of thumb is that stocks need to deliver an earnings yield that is more than 100 basis points higher than the yield on short term (3-month treasury) paper to compensate investors for the risks associated with holding equities. Today, the earnings yield on the S&P 500 is well in excess of that level, and the below illustration shows favorable spreads to maturities even further out on the yield curve. The ratio is unlikely to change until either earnings reaccelerate or rates surge higher.
Terry Gardner Jr. is Portfolio Strategist and Investment Advisor at C.J. Lawrence. Contact him at tgardner@cjlawrence.com or by telephone at 212-888-6403.