- August 5, 2019
- Blog , The Portfolio Strategist - Terry Gardner
C.J. Lawrence Weekly – Equity Risks Rise but Relative Yield Comparison Still Favors Stocks
The Federal Reserve Board’s Open Market Committee (FOMC) reduced the Fed Funds target rate by 25 basis points last week. The move marked the first time the Fed reduced the target rate in over a decade. While the broader markets may have been looking for more than 25 basis points, investors eventually took the cut in stride. That was until President Trump signaled that, as a result of stalled U.S.-China trade negotiations, the U.S. would impose 10% tariffs on $300 billion of Chinese imports beginning on September 1. The reaction to the announcement was swift. The S&P 500 Index dropped 2.6% from the time of the President’s tweet on Thursday to the end of trading on Friday.
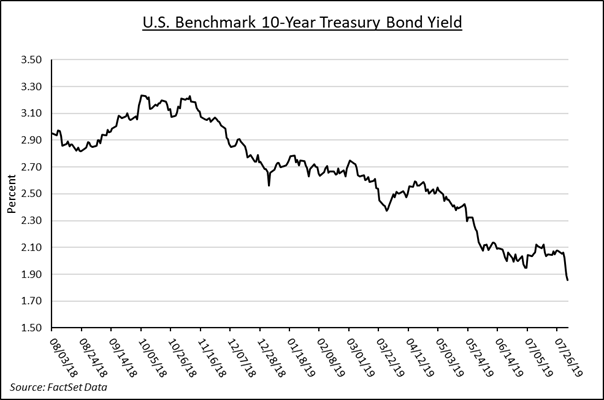
Perhaps the bigger reaction was felt in the bond market. Having already given up 7 basis points in Thursday’s trading session, the yield dropped another 10 basis points from the time of the Trump trade tweet to the end of trading on Friday. The dramatic intra-day moves highlight how sensitive the markets have become to trade issues and the risks that slowing trade presents for the global economy. The softness in trade and slowdown in China’s activity are already being felt by its largest trading partners outside the U.S. including Japan, South Korea, Singapore, and Germany which have all reported weaker than expected GDP and PMI (purchasing manager index) results. The U.S. 10-Yr Treasury yield is now down over 130 basis points since its October 2018 peak. The President may not have convinced the Fed’s Chairman Powell to cut more aggressively at the short end of the yield curve, but the President is certainly getting his wish at the long end of the curve!
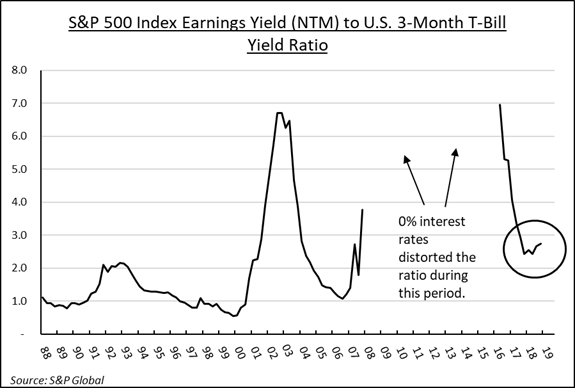
Stock investors are now trying to balance the relative benefits of falling bond yields versus the impact of slowing global growth on corporate earnings. 2Q19 earnings results have generally come in ahead of expectations but are below last year’s levels in most cases. Estimates for the remainder of 2019 have been falling steadily and 2020 forecasts look suspect. But compared to bond yields, stocks still maintain their advantage. Our comparison of the earnings yield on stocks (inverse of P/E) versus the yield on three-month T-bills continues to tilt heavy towards stocks. The rule of thumb for this model has been that when the ratio is higher than 1.0, stocks exhibit higher relative value. The ratio has been declining since the 0% interest rate period of the financial crisis but found a floor around 2.55 last year. The ratio now stands at 2.75. The neighborhood may be suspect, but stocks remain the nicest house.
Terry Gardner Jr. is Portfolio Strategist and Investment Advisor at C.J. Lawrence. Contact him at tgardner@cjlawrence.com or by telephone at 212-888-6403.