- June 24, 2019
- Blog , The Portfolio Strategist - Terry Gardner
C.J. Lawrence Weekly – Interest Rate Cuts May Stave Off Reckoning for Highly Leveraged Companies
One metric we like to watch to help gauge the health of S&P 500 companies is the Interest Coverage Ratio. The ratio measures how easily a company can pay its debt. In aggregate, the Index’s ratio provides insight into the health of corporate balance sheets and supporting cash flow. The ratio is calculated by dividing a company’s earnings before interest charges and taxes (EBIT) during a given period, by the company’s interest payments due during the same period. One of the benefits of a declining interest rate environment is that it lowers the corporate cost of capital. Qualifying companies tend to use these periods to increase borrowing and/or refinance existing debt at lower rates, improving interest coverage. So long as sales and margins hold, indebted companies can grow earnings by lowering interest expense. That is one of the bullish underpinnings of a declining rate environment.
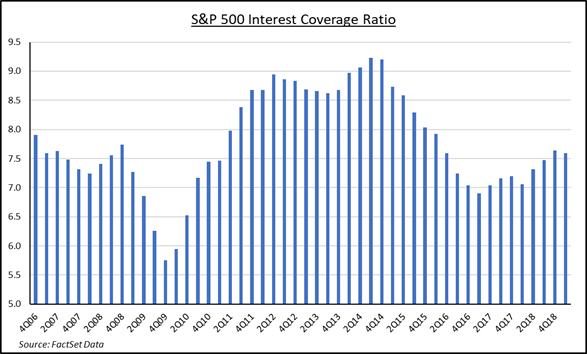
Post financial crisis, coverage ratios soared as credit dried up and companies were forced to deliver balance sheets. The deleveraging process continued until about the third quarter of 2014 when credit markets loosened allowing issuers to take advantage of lower rates, issue new debt, and refinance older, higher rate debt. In fact, during the period from 2014 to 2017, corporate debt grew faster than cash flow. According to data from the Securities Industry and Financial Markets Association (SIFMA), during this period corporate bond debt outstanding rose 21.6% while S&P 500 cash flow per share rose 10.6%. But over the past several quarters the trend in coverage ratios reversed as corporate cash flow growth reaccelerated and borrowing growth subsided. Current levels are near historic averages providing comfort to balance sheet focused investors. For highly leveraged companies, falling interest rates may provide relief from softening business conditions that pressure cash flow and earnings. Thus, the current credit cycle looks benign, until you consider a recent study conducted by the Dallas Federal Reserve Bank.
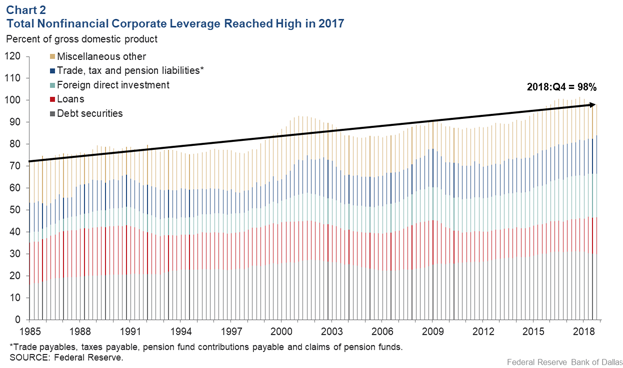
The authors of the May 2019 study examine Federal Reserve Flow of Funds Data measuring debt-to-GDP. Historically, this ratio considered bond debt outstanding as the proxy for corporate indebtedness. But the authors’ recent study includes other forms of borrowing to generate a more comprehensive debt picture. By including loans from private equity funds and hedge funds, trade finance and foreign direct investment, which sometimes contains both debt and equity components, in addition to outstanding loans and bonds, the authors found that the ratio of total nonfinancial corporate liabilities compared to GDP is more worrisome than traditional measures suggest. Including these non-traditional forms of debt drives the total US Debt to GDP ratio from the current 47% to over 98%! While the total non-corporate financial category is broader than the S&P 500 Index, the point is that traditional leverage ratios may understate total corporate indebtedness. Highly leveraged companies may get a reprieve in a declining rate environment, but eventually the mounting pile of debt will come due. Investors may want to take note of all forms of indebtedness in their leverage analysis and avoid stocks of companies that pile on additional debt to off-set slowing business, versus those who take advantage of low interest rates to borrow growth capital.
Terry Gardner Jr. is Portfolio Strategist and Investment Advisor at C.J. Lawrence. Contact him at tgardner@cjlawrence.com or by telephone at 212-888-6403.