- March 18, 2019
- Blog , The Portfolio Strategist - Terry Gardner
C.J. Lawrence Weekly – Free Cash Flow Is King
Last week’s U.S. economic data releases sent mixed signals. The U.S. industrial economy continues to slow, as indicated by weaker-than-expected Industrial Production and Capacity Utilization readings. But the consumer economy remains robust, bolstered by low unemployment and persistent consumer optimism. The January Job Openings and Labor Turnover Survey (JOLTS) report showed a surge in job openings to a new high of 7.6 million. That suggests there are now more job openings than there are candidates to fill them. The rosy employment outlook is boosting U.S. consumers’ confidence that their economic prospects are good. In fact, the University of Michigan’s Consumer Confidence Index, released last week, showed a jump to 97.8 from 93.8 in the prior month. As we discussed in last week’s note, the U.S. consumer is doing the heavy lifting for both the U.S. and the global economies, so last week’s jobs and confidence measures were reassuring.
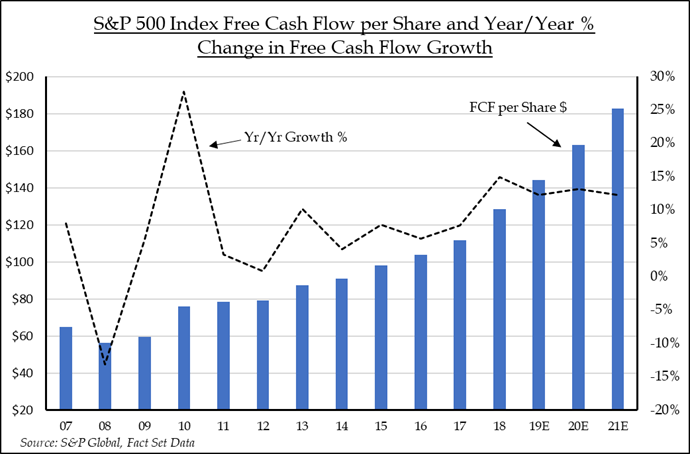
Also reassuring is the emerging outlook for free cash flow generation among S&P 500 companies. In 2019, free cash flow per share for the Index is expected to reach a record $183 per share, up 12.2% from 2018’s level, which was up 15% from 2017’s level. Free cash flow is an important measure to the market because it represents management teams’ capital optionality and acts as a cushion when business conditions are challenging. Broadly calculated by adding capital expenditures back to a company’s net cash flow from operations, free cash is often used to pay dividends, buy back stock, or for acquisitions. Aggressive growth companies will often use their free cash to expand their domain through acquisitions. Thus, should corporate borrowing costs stay low and free cash flow continue to rise, 2019 could set up to be a busy year for merger and acquisition activity. History has demonstrated that periods of buoyant M&A tend to be good for stock prices since they add new stock buyers to the marketplace.
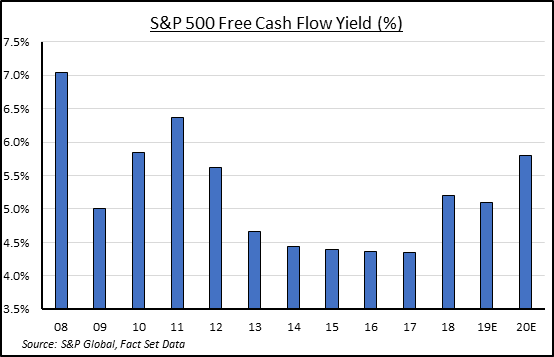
To avoid traps, investors should be wary of high cash flow yielding companies that are scaling back capital expenditures. The reduction in near-term expenditures (investments) inflates free cash flow but often does so at the expense of plant and equipment improvement and potential future growth. To identify high cash flow yielding companies and compensate for deferred capital expenditure risk, we ran a screen of the S&P 500 that included companies with a 2019 free cash flow yield in excess of the market (5.2%) but excluded those with an average 3-year annual capital expenditure growth rate below 5%. For the purpose of this exercise, we excluded financials since they don’t typically invest much in the way of capital expenditures. The result is a list of 90 high quality companies with a high concentration in both technology and health care. While those are often the sectors that have heavy capital spending burdens, they also tend to be the sectors with the best margins and cash flow generation. Companies that reinvest in their own businesses and generate increasing amounts of cash flow tend to outperform in any market. But those are particularly attractive attributes in markets where economic growth is plateauing or slowing. As economic growth rates at home and abroad are recalibrated, corporate free cash flow generation will likely rise on investor priority lists.
Terry Gardner Jr. is Portfolio Strategist and Investment Advisor at C.J. Lawrence. Contact him at tgardner@cjlawrence.com or by telephone at 212-888-6403.