- May 7, 2018
- Blog , The Portfolio Strategist - Terry Gardner
C. J. Lawrence Weekly – Falling Down on the Multiple Staircase
S&P 500 earnings per share estimates (EPS) for 2018 have increased 8.8% since the beginning of the year, and look to be heading higher. 2019 estimates have climbed by about the same amount. The Index price, however, is not following suit, and is down slightly (-.38%) year-to-date. The road block to higher stock prices is the contracting market multiple, or the price that investors are willing to pay for future earnings. At the beginning of the year, the S&P 500 price-to-earnings multiple (P/E) stood at 18.5x. Since then, it has declined by 9.6%, more than off-setting the positive EPS estimate revisions. This is a classical late-cycle set up. In previous cycles, the market multiple declined as investors discounted what they believed to be “peak earnings”. At this point in past cycles, the expectation would emerge that the Federal Reserve would tighten monetary policy to slow an over-heating economy and curb rampant inflation. Often, that strategy also put in a top for corporate revenue and profit growth. The challenge to applying that narrative to today’s market is that we have neither an over-heated economy nor run-away inflation! Most economists agree that the Fed’s current tightening agenda is aimed more at normalizing rates than on reigning in excesses. In fact, it wasn’t six months ago when interest rate conversations revolved around the hope that the Fed’s easy money policies would eventually stoke some much-needed inflation.
Directionally, the market multiple tends to move opposite of interest rates and inflation. As the risk free-rate on U.S. treasury bonds rises, asset allocators require increasingly higher earnings yields on stocks to compensate for their risk. But P/E multiples also move directionally in long cycles. In the 1980s, C.J. Lawrence Chairman, Jim Moltz, observed the long-term cyclical trends in P/E multiples and coined the progression, the “Multiple Staircase” (see chart below). The Multiple Staircase showed that the S&P 500 P/E multiple trended in stair-step fashion, in one direction for about 12 years, before reversing course and trending in the other direction for 18 to 20 years. The market multiple found the bottom of the Staircase in 2011 and has worked higher since. If the progression holds true, there would be another 12 years of elevated multiples in the current cycle. While it’s difficult to make a case for meaningfully higher valuations from current levels, the current range has precedence.
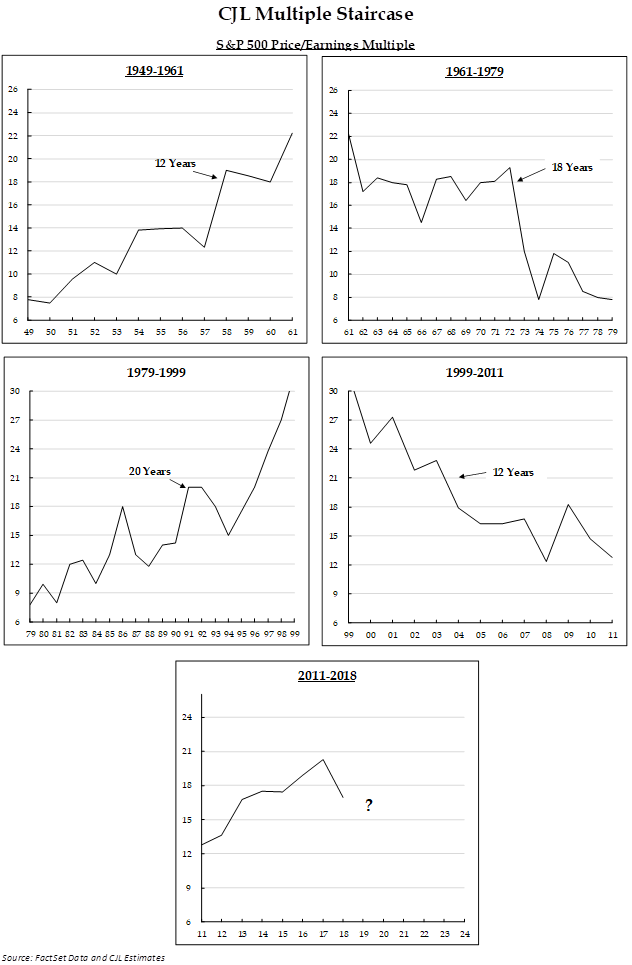
S&P 500 Price/Earnings Multiple
Two previous periods with similar economic conditions to the current environment, were the 1960-1967 and the 2002-2007 periods. During these years of steadily increasing interest rates and inflation, the average P/E multiple on the S&P 500 ranged between 16.0x and 18.5x. Applying that range to today’s earnings forecasts would yield an Index price range, on the S&P 500, of 2,560 (-4.0%) to 2,960 (+11.2%). Perhaps the uncertainty around global trade trims the top off the range, but a steady improvement in economic activity, without a corresponding spike in inflation, may support the P/E multiple on the bottom edge. The market multiple may have stumbled on the Multiple Staircase but any signs that “peak earnings” are not yet in sight may help it regain its balance.
Full Disclosure: Nothing on this site should be considered advice, research or an invitation to buy or sell securities, refer to terms and conditions page for a full disclaimer.