- March 5, 2018
- Blog , The Portfolio Strategist - Terry Gardner
C.J. Lawrence Weekly – Bond Yield Forecasts Still Not Competitive with Earnings Yield on Stocks
Our CJL Market Monitor reading weakened in February, understandably, as interest rates rose and previously positive market technical measures reversed course. The Monitor remains narrowly in BUY territory with a +1 reading, on a scale of -6 to +6. The two components that lost ground in February include our Year/Year Long Bond Model, and our NYSE Composite Moving Average Spread Model. The Long Bond model incorporates moves in the U.S. 30-Year Treasury Benchmark Bond yield. That model had generated a BUY signal in previous months as movement at the long end of the yield curve stalled. But the 30-Year Treasury yield made a meaningful move higher in February, and nudged that component’s reading into NEUTRAL territory. The NYSE Composite Moving Average Spread model also dropped a level as equity market volatility returned and positive market momentum was broken.
The interest rate components of the Monitor highlight the importance of the rate of change in bond yields versus the direction and levels of equity earnings. But the rate sensitive components have been less useful over the past decade as record low rates tilted those component models overwhelmingly towards stocks. Those measures are now working themselves back into normal balance. As they do, the conundrum will be how to calibrate the rate of change in interest rates versus their still historically low absolute levels. The current yield on the U.S. 3-Month T-bill is ~1.65%. Many Fed watchers are forecasting that three to four 25-basis point interest rate hikes are in the cards over the next twelve months. If these forecasts prove accurate the U.S. 3-Month T-bill yield should reach ~2.65% by this time next year. The last time the T-bill yield was at this level, and rising, was in January of 2005. The T-bill rose almost 200 basis points that year. Despite rising rates being a headwind for stocks, the S&P delivered a 4.8% total return in 2005 and a 15.8% return in 2006, as rates continued to climb. Headline CPI was 3.4% and 3.2% in 2005 and 2006, respectively.
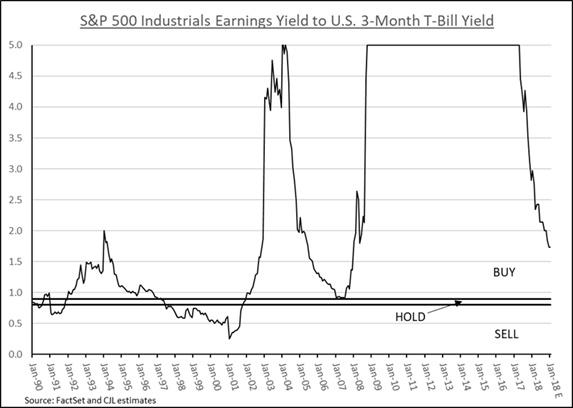
S&P 500 Industrials Earnings Yield to U.S. 3-Month T-Bill Yield
To find another period when U.S. T-bill rates were ~2.65% and rising, one must go back to 1962. In that year T-bill yields began an ascent that took them to 5.2% in November of 1966. The S&P 500 struggled in the first year of that rate cycle, posting a -8.8% return in 1962, but delivered total returns of 22.6%, 16.4%, and 12.4% in 1963, 1964, and 1965 respectively. The S&P 500 earnings profiles in both periods (1962-1966 and 2004-2006) looks similar to today’s outlook, with EPS growing, and expected to grow, at a double-digit rate for three consecutive years. Another of our Market Monitor’s components takes earnings into account by measuring the Earnings Yield (inverse of the P/E) on stocks versus the 3-Month T-bill yield. At current levels of forecasted S&P earnings, the T-bill yield would have to ise to 5.1% for that component to flip in favor of bonds. It’s likely that rising rates, from any level, will provide a sentiment headwind for stocks, and will continue to pressure the market multiple. But history suggests that in periods of rising bond yields off multi-year lows, concurrent with double digit S&P 500 earnings growth, stocks can deliver attractive absolute returns and have historically outperformed bonds on a relative basis.
Full Disclosure: Nothing on this site should be considered advice, research or an invitation to buy or sell securities, refer to terms and conditions page for a full disclaimer.